WAVE OF INDUSTRIAL SUPPLY SLIGHTLY INCREASES VACANCIES, BRINGS LITTLE RELIEF TO RISING RENTS
March 2, 2023
WAVE OF INDUSTRIAL SUPPLY SLIGHTLY INCREASES VACANCIES, BRINGS LITTLE RELIEF TO RISING RENTS
As we cruise through the first quarter of 2023, we take pause to reflect and see if the headwinds of the past year and their resulting predictions are beginning to play out in the market – headwinds such as e-commerce adoption, labour shortages, ballooning construction costs, 40-year-high interest rates, and tough-to-find industrial assets.
Looking back to 2022, we saw record-breaking transactions as investors scooped up industrial properties and land at watermark values while industrial rents experienced year-over-year increases of over 20%. Developers moved quickly to supply much-needed inventory, bringing the industrial pipeline across the Greater Golden Horseshoe area to a reported 36 million square feet by end of 2022 – up from 23 million square feet a year earlier.
At the same time, inflationary pressures spurred Central Banks to begin hiking interest rates, which saw consumer spending slow (for the first time since the pandemic) and companies announcing layoffs to cut costs and ‘correct’ any over-hiring that took place.
This juxtaposition of explosive growth with cautious hedging is natural in an economic landscape where a paradigm shift or sudden shock to demand threatens to break the underlying system. We see this all too often in companies that grow too quickly for its operations to keep up; a balancing act in supporting the core business while staying lean.
This begs the question if the Greater Toronto and Greater Golden Horseshoe industrial markets saw ‘over-building’ in response to e-commerce growth? And if it did, what might its impact be over the coming 12-24 months?
Looking forward, industrial deliveries across the GGH are expected to more than double in 2023 to 23.4 million SF, with net deliveries forecast at 21.7 million SF. Because of this, it is further expected that absorption will hit 16.4 million SF (theoretically bringing 5.3 million SF of opportunity) while the vacancy rate will double from 0.9% to 1.8%.
Given that a healthy market is thought to be at a 4% to 5% vacancy rate, this additional slack provides little cause for concern. What will be interesting to follow is how the (so far tracked) 32.5 million square feet slated for delivery in 2024 and 2025 will affect the logistics and warehousing market, especially if we see continued rate hikes and/or an economic slowdown.
That is why, today, we will analyze and explore the potential effects of this wave of deliveries across the Greater Toronto and Greater Golden Horseshoe industrial markets.
Flood of Industrial Deliveries Creates Uptick In Availabilities
As outlined above, we will seek to explore whether the Greater Toronto and Greater Golden Horseshoe’s combined 55.9 million SF of construction pipeline through 2025, coupled with a softening economy, will impact vacancies and rental rates, and if so, to what extent.
For the figures below, the Greater Golden Horseshoe area is depicted in orange, while the GTA West is in dark blue; the GTA East in green; the GTA Central in light blue; and the GTA North in yellow.
Figure 1 depicts the industrial pipeline for buildings over 70,000 square feet across the Greater Toronto Area (GTA) and the Greater Golden Horseshoe Area (GGH) since Q1 2020. The GTA’s West region, comprised of Mississauga, Brampton, Caledon, Halton Hills, Milton, Burlington, and Oakville has been consistently the busiest; with just over 10.6 MSF currently under construction. The West is closely followed by the Greater Golden Horseshoe with just under 7.5 MSF underway.
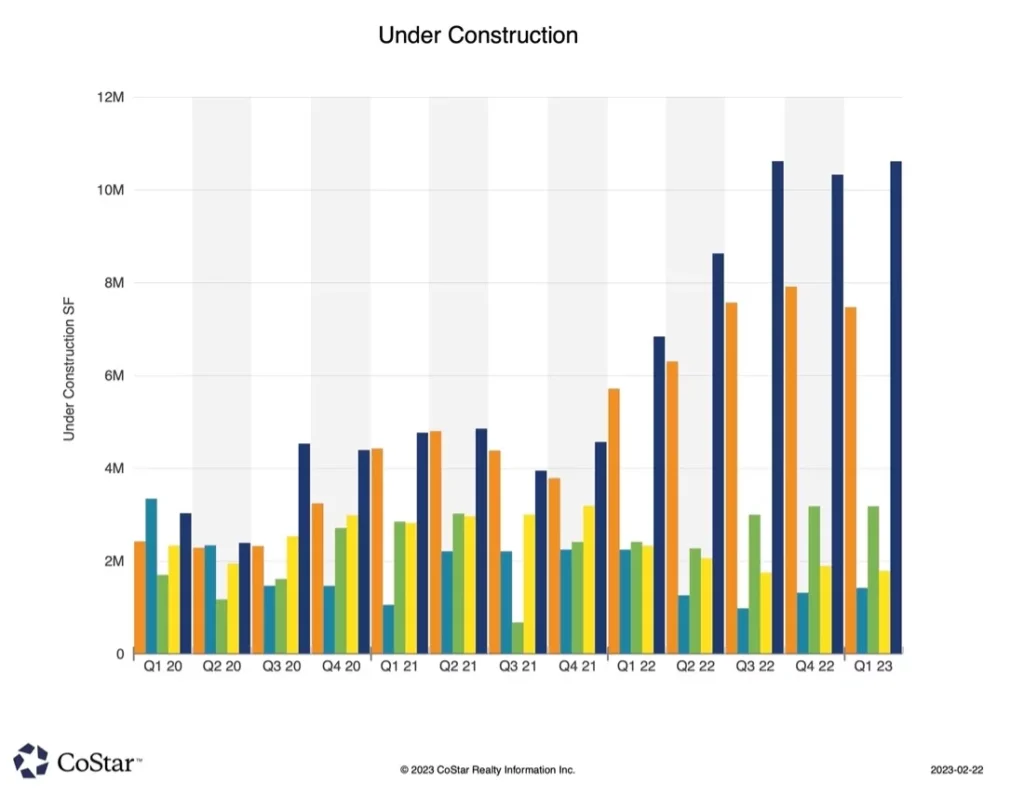
Figure 1: GTA/GGH Industrial Space Under Construction by Region, Quarterly. Source: CoStar.
Meanwhile, Figure 2 shows construction deliveries for all regions since 2020. As is expected, both the GTA West and GGH are forecast to lead the way in 2023 – both with approximately 5 MSF of space coming online, followed by the GTA East at 1.6 MSF, and the GTA North and Central regions with 1.3 MSF each.
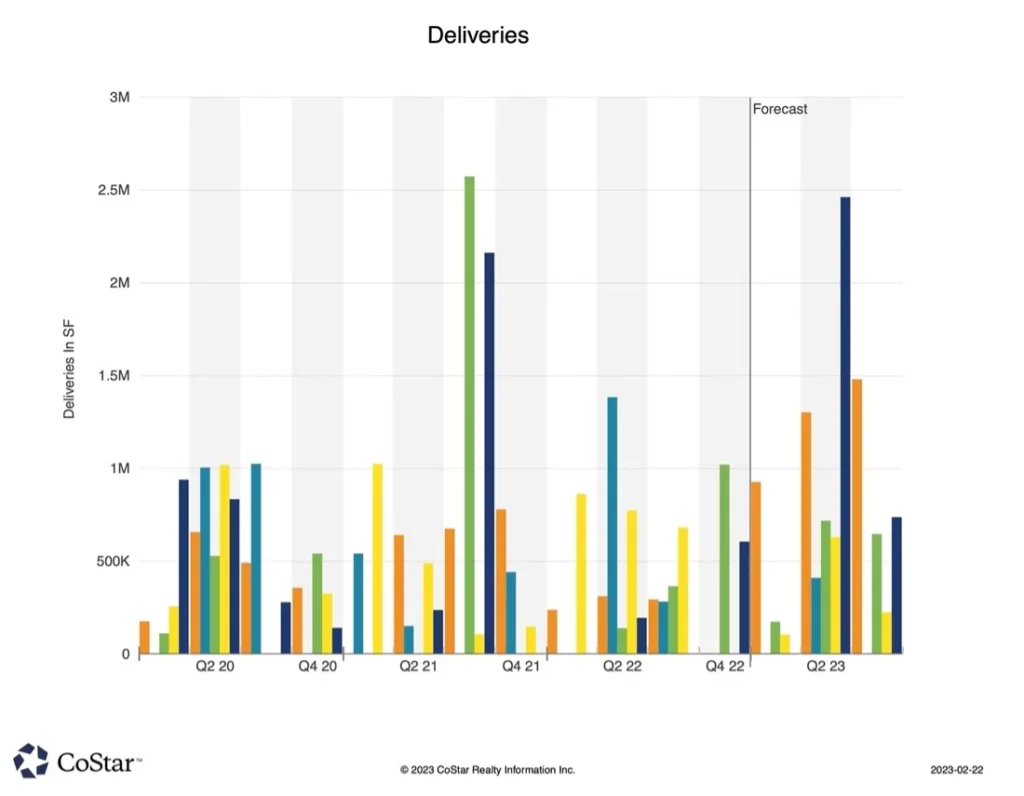
Figure 2: GTA/GGH Industrial Deliveries by Region, Quarterly. Source: CoStar.
Expected Rent Relief Yet to Materialize
With all of these aforementioned factors at play, the real question on the mind of every retailer and logistics or transportation provider (as well as developers and investors) is whether vacancies and rents will return to more ‘normal’ levels as bottlenecks and backlogs are worked through.
Looking to Figure 3, we see that year-over-year rental growth peaked in Q4 2022 at an average of 20.6% in the Greater Toronto Area and 16.3% in the Greater Golden Horseshoe. Year-to-date, those figures have dropped slightly to 19.7% in the GTA but increased to 16.6% in the GGH. What’s interesting, however, is that all Regions’ rental rates are forecast to hit a 7% run-rate by 2024 and stabilize at 3% by 2026. If this holds true, we expect most assets to test a range between the mid-teens to low-twenties per SF net, depending on the quality, location, accessibility, and features. With that in mind, rents have been forecast to stabilize in the past and, according to street-level intel, they continue to increase with annual escalations typically at 4% per annum.
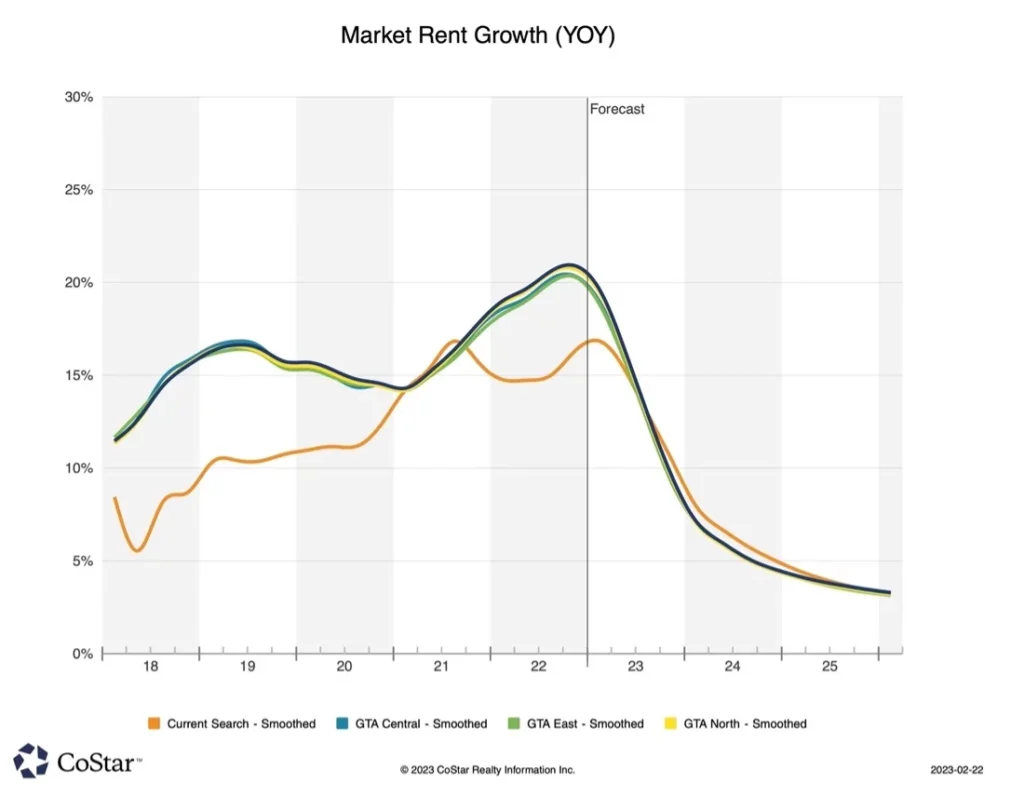
Figure 3: GTA/GGH Industrial Rent Growth YOY by Region, Quarterly. Source: CoStar.
Finally, Figure 4 shows the industrial vacancy rate by region, with the GTA West currently the tightest submarket at just 0.6%, followed by the GGH and GTA East at 0.8%, the GTA North at 1.2%, and GTA Central at 2%. All submarkets are forecast to have between 1% and 2.5% vacancies by year-end 2023 and are expected to stabilize at an average vacancy of 1.8% by 2026.
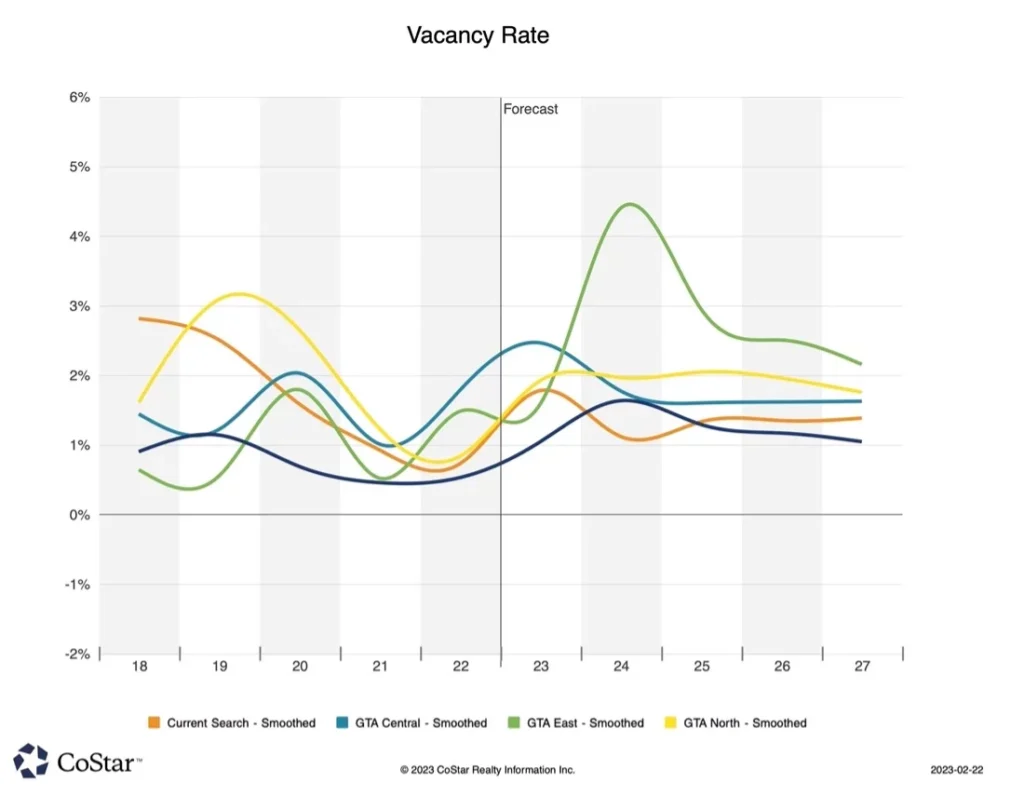
Figure 4: GTA/GGH Industrial Vacancy by Region, Annually. Source: CoStar.
Summary
Taking together all of our previous observations, while there are still many unanswered questions, we can reasonably confident that the GTA and GGH industrial market will remain strong, albeit, it will move at a slower pace.
Businesses looking to fulfil their growth plans will still need to plan ahead and formulate the right strategy to ensure they secure space. At the same time, we may see developers become more cognizant of competing projects and be less quick to build on spec; opting to build-to-suit or joint-venture with a tenant in tow.
Many of our clients are approaching us looking to pre-lease or develop, and our team has access to specialists who can help guide and manage the process from inception through move-in.
On that note, if you would like our team to assist with any of your real estate needs, or if you would like to discuss anything mentioned in this article, please contact us directly.

