THE ‘BULLWHIP EFFECT’ OF INDUSTRIAL REAL ESTATE
July 21, 2022

The ‘Bullwhip Effect’ of Industrial Real Estate
Recent headlines have brought into focus an emerging phenomenon that is impacting retailers across North America – a phenomenon whose origins began two and a half years ago at the beginning of the economic shutdowns.
Procuring, manufacturing, warehousing, and shipping goods – at the quantity and speed demanded by consumers – has been incredibly challenging given the bottlenecks throughout the supply chain. Retail, logistics, and transportation firms have responded by quickly growing their footprints, investing in new technologies, and hiring enormous pools of labour to meet and exceed expectations.
Statements were made by industry leaders that they would never be caught off guard again. Supply chains would be retooled to become more agile and with buffer stock ‘just-in-case’ any future shortages popped up again.
In an ironic twist, orders which had been delayed for many months are now creating a flood of inventory just as consumer demand begins to dip due to inflation, rising interest rates, and now, an official recession south of the border. The pendulum finally swung the other way. As a result, we have seen massive order cancellations and price cutting in an effort to move product quickly.
However, this ‘bullwhip effect’ isn’t limited solely to the inventory of goods and materials. As an example, executives at the e-commerce leviathan Amazon have mentioned on earnings calls that their profitability has taken a hit due to an abundance of labour that was brought in to help manage the peak Holiday season. At the same time, the company has publicly announced a pullback in their real estate footprint and put well over a dozen projects on hold.
Similarly, the Greater Toronto industrial market began to heat up around 2018, only momentarily pausing in early 2020 before catapulting into the stratosphere, where it remains today. Availabilities have dipped below 0.7%, while rents and values are approaching $20 per square foot net and $450 per square foot, respectively. Developers are bringing on board more than 16.5 million square feet of inventory in the pipeline, and although a sizeable portion is already pre-leased, it’s no stretch of the imagination to consider that some of these projects may too be put on hold.
That is why, today, we will explore whether the Greater Toronto industrial market may be subject to its own ‘bullwhip effect’ in the coming 18 to 24 months.
Will We See Supply Overshoot Demand in the Coming 18-24 Months?
As outlined above, we will seek to explore whether the Greater Toronto Area’s 16.5 million SF of construction pipeline, coupled with a softening economy, will lead to a shift in the market towards greater availabilities, and if so, to what extent.
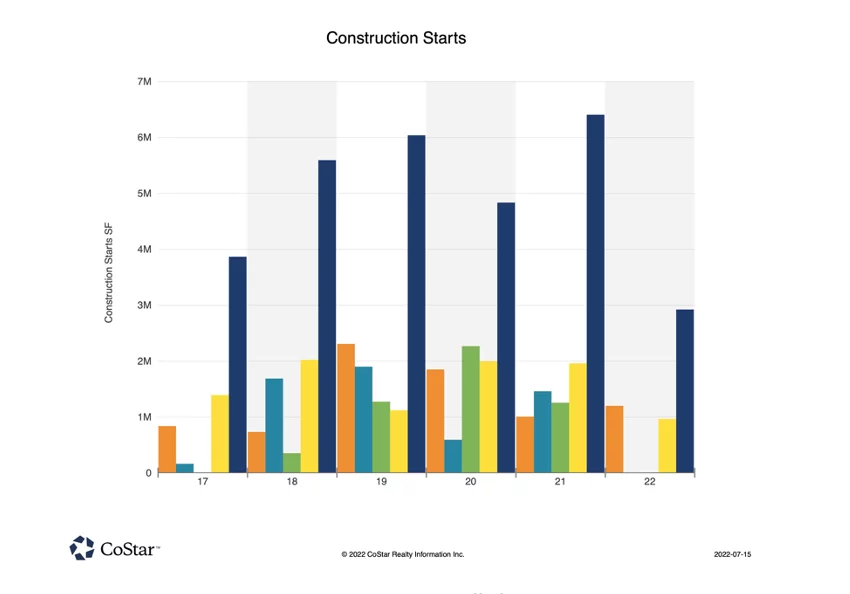
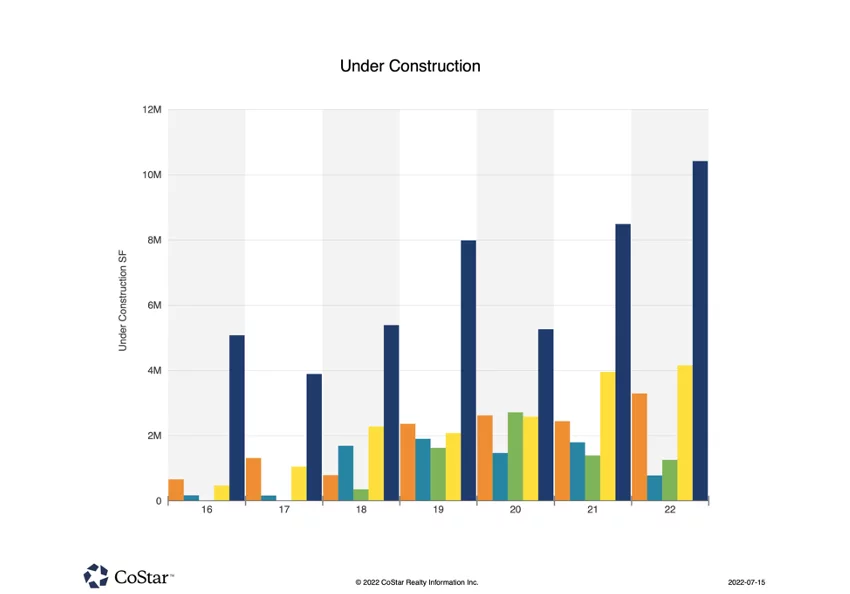
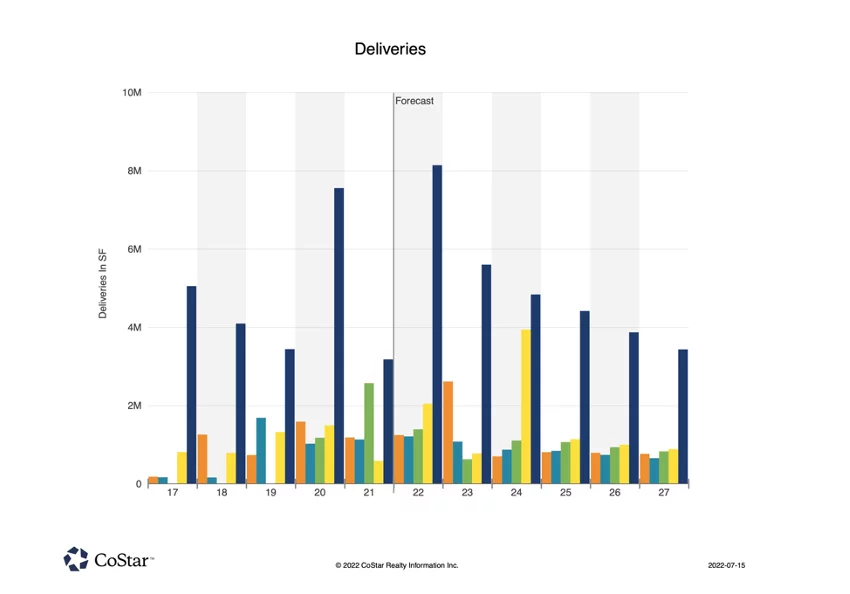
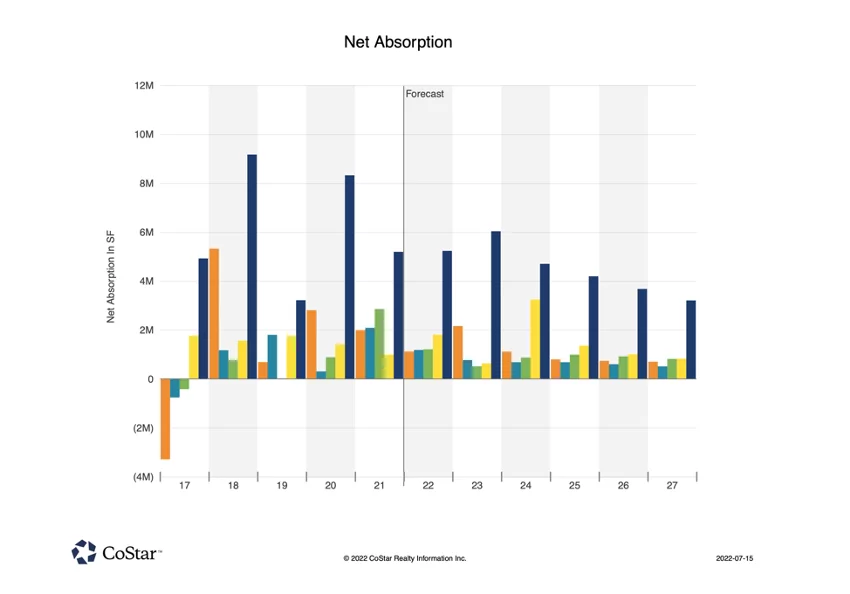
For the figures below, the Greater Golden Horseshoe area is depicted in orange, while the GTA West is in dark blue; the GTA East in green; the GTA Central in light blue; and the GTA North in yellow.
Figure 1 depicts construction starts for industrial properties over 100,000 square feet across the Greater Toronto Area (GTA) and the Greater Golden Horseshoe Area (GGH). The GTA’s West region, comprised of Mississauga, Brampton, Caledon, Halton Hills, Milton, Burlington, and Oakville has been consistently the busiest; with just over 6.4M SF of starts in 2021 – surpassing the total of all other regions in the time period. This was followed with over 2.9M SF of starts in 2022 thus far.

Figure 1: GTA Construction Starts Annually by Region. Source: CoStar.
A similar pattern can be seen in Figure 2 where the GTA West historically and currently leads all other regions – often exceeding the sum of all others – with 8.5M SF and 10.4M SF of space under construction in 2021 and 2022, respectively. For context, the next busiest region, the GTA North, saw 3.9M SF and 4.15M SF in construction in 2021 and 2022, respectively, while third place GGH saw 2.4M SF and 3.3M SF in construction during the same periods, respectively.

Figure 2: GTA Construction Starts Annually by Region. Source: CoStar.
Figure 3 continues this narrative, as the GTA West leads all regions with 3.1M SF of deliveries in 2021 and an estimated 8.1M SF in 2022, followed by the GTA East with 2.6M SF of deliveries in 2021, and the GTA North with an estimated 2.05M SF in 2022.

Figure 3: GTA Industrial Annual Deliveries by Region. Source: CoStar.
Finally, Figure 4 shows net historical and forecast net absorption by region, with the GTA West seeing approximately 5.2M SF absorbed in 2021 and with expectations of the same figure in 2022, and just over 6M SF in 2023. Looking to other regions, the GTA East was the runner-up in 2021 with 2.8M SF of absorption, the GTA North is expected to do so in 2022 with 1.8M SF, while the GGH is forecast to absorb over 2.1M SF in 2023 thanks to the boom in construction and relocation of some occupiers to secondary markets.

Figure 4: GTA Industrial Annual Net Absorption by Region. Source: CoStar.
Summary
Overall, and despite the potential headwinds aforementioned, the GTA industrial logistics market remains red-hot, with all-time-low availabilities and supply challenges. Although it is possible that supply may overshoot demand in the coming 18-24 months (for the first time in many years), long-term vacancies are forecast to stabilize at around 1%-1.5% in the coming 2-5 years.
In any event, businesses looking to fulfil their growth plans should plan ahead and consider their options between the Greater Toronto Core and secondary markets, such as the Greater Golden Horseshoe and Greater Hamilton Areas. Further, they should consider build-to-suit developments or joint-venture projects with reputable developers. While this option may take anywhere from 18 to 24 months to complete, it will ensure you have the right facility for your needs.
Many of our clients are approaching us looking to pre-lease or develop, and our team has access to specialists who can help guide and manage the process from inception through move-in.
On that note, if you would like our team to assist with any of your real estate needs, or if you would like to discuss anything mentioned in this article, please contact us directly.

