HOW CONVERGING HEADWINDS MAY AFFECT THE GREATER TORONTO LOGISTICS MARKET
August 30, 2022
How Converging Headwinds May Affect the Greater Toronto Logistics Market
GTA Industrial Logistics Market Snapshot
As numerous headwinds converge, many real estate managers, business owners, developers, and investors are expressing cautious optimism towards the Greater Toronto industrial market.
For investors, rising interest rates and inflation, coupled with record-level industrial construction, may impact the volume of speculative construction and steer strategy inwards towards optimizing existing portfolios and product pipelines.
For owner-occupiers and corporate tenants, the pullback by large retailers, such as Amazon and WalMart, may signal relief in the coming months in terms of available space and easing rent increases; albeit, high-quality logistics space remains scarce and expensive.
With approximately 18 million square feet of warehousing and distribution facilities under construction across the Greater Toronto Area, and another 4.2 million square feet going up in the surrounding Greater Golden Horseshoe Area, we may finally see enough supply come on-stream to reduce froth in the market.
As it sits now, the GTA industrial market availability rate sits at just 0.9%, and over 52% of new development has already been pre-leased, pushing rents up 17.8% year-over-year to $14.73 PSF Net, with well-located Class-A space often fetching values in excess.
That said, costs vary by submarket (and even by project), so understanding how demand and supply are shifting within the GTA and GGH may be the best strategy to uncover opportunities in the coming months.
On that note, let’s examine the state of the GTA and GGH industrial logistics market.
Key Metrics – GTA Industrial Logistics Inventory – 2022-YTD
- Average Rent: $14.73 PSF (+17.8%)
- Vacancy: 0.9% (+0.1%)
- Inventory: 528M SF (+0.5%)
- Net Absorption: 2.1M SF
- Under Construction: 17.6M SF
- Sales Transactions: 329
- Sales Volume: $2.5B
- Average Sale Price: $288.64 PSF
- Cap rate: 4.2%
Looking at the key metrics above, we notice a further tightening of the GTA logistics market – with rents and values increasing significantly year-to-date. Furthermore, over 17.8M square feet of logistics-focused industrial space is slated to come on-stream in the coming 18-36 months, however, much of it, as we will show later on, is already pre-leased.
Notable GTA and GGH Industrial Leasing Transactions
Figures 1 and 2 capture the top industrial leasing transactions by size across the Greater Toronto Area and Greater Golden Horseshoe over the past 12 months. Retailers, logistics, and food companies dominate the list, and there has been a marked slowdown in transactions in Q3 2022 to-date.
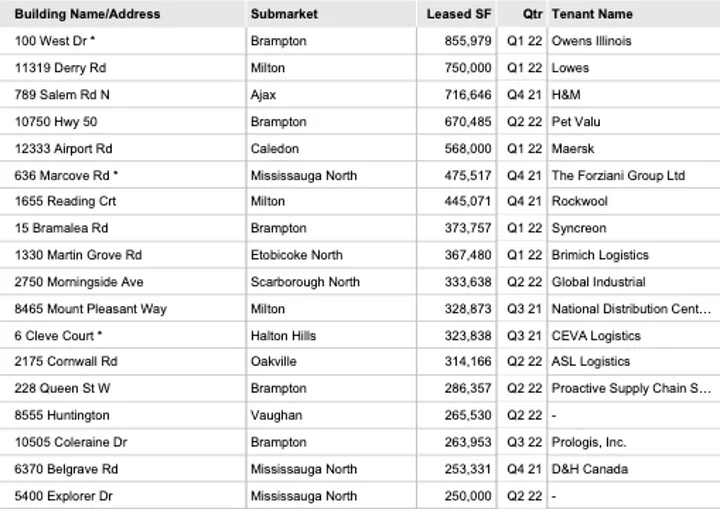
Figure 1: Top 18 GTA Leasing Transaction from Past 12 Months. Source: CoStar.
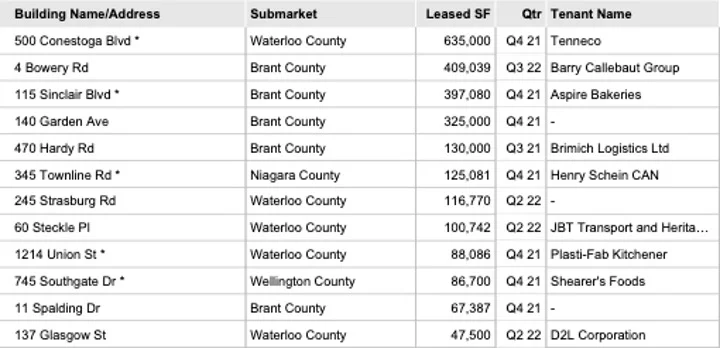
Figure 2: Top 12 GGH Leasing Transactions from Past 12 Months. Source: CoStar.
Digging deeper, Figure 3 breaks down the relative industrial rents by key submarkets. This spread can be seen when comparing Core markets, such as Mississauga South at $15.97 PSF Net and Brampton at $15.22 PSF Net, to Outlying markets such as Waterloo County at $11.15 PSF Net and Brant County at just $8.04 PSF Net.
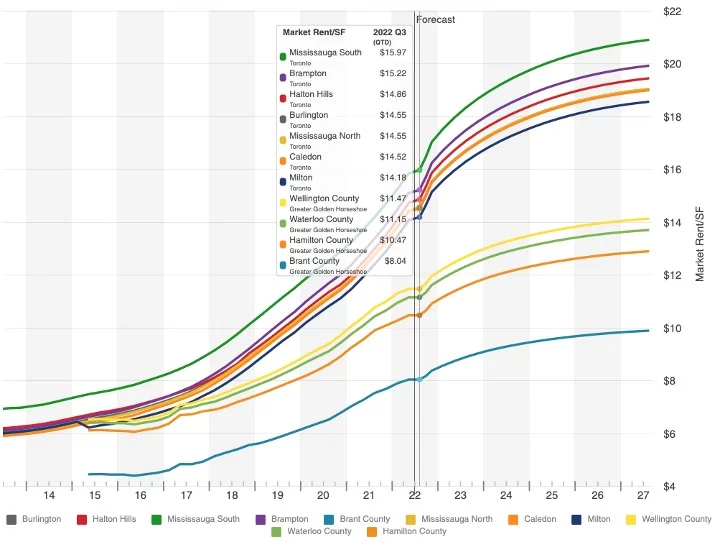
Figure 3: GGH Relative Industrial Rents by Submarket. Source: CoStar.
GTA and GGH Logistics Pipeline of New Construction
Complementing the charts above, Figures 4 and 5 outline new industrial construction in the GTA and GGH by submarket. Some important takeaways:
GTA Construction:
- The average size of new construction is head and shoulders above the average size of all existing industrial properties, thanks to the demand for ‘Big Box’ warehousing.
- Approximately 9.4M SF out of 18M SF – or 52.4% of new construction – has been pre-leased, with the balance likely being shopped around or in the process of being accounted for.
- Brampton and Milton lead the way in total available space under construction (a combined approximate 4.3M SF), while Halton Hills and Markham are fully pre-leased (according to existing data) despite having 877,000 SF of new construction over 3 facilities being delivered.
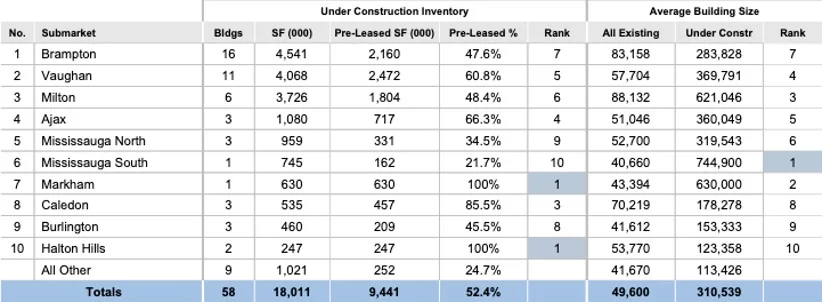
Figure 4: GTA Industrial Construction by Submarket. Source: CoStar.
GGH Construction:
- The average new build in the GGH is 182,257 SF, significantly smaller than in the GTA, where new construction averages 310,539 SF.
- Approximately 2.1M SF out of 4.19M SF – or 49% of new construction – has been pre-leased, with the balance likely being shopped around or in the process of being accounted for.
- Waterloo and Hamilton Counties lead the way in terms of available space (a combined approximate 1.85M SF), while Brant and Niagara Counties are fully pre-leased (according to existing data) despite having 784,000 SF of new construction being delivered across 4 properties.
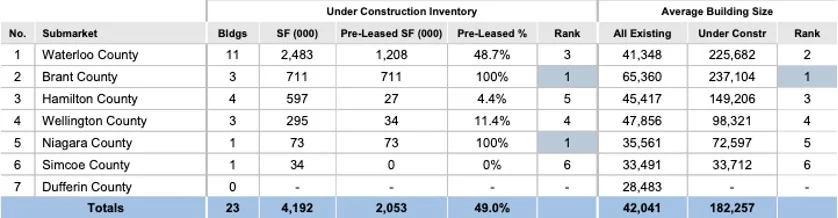
Figure 5: GGH Industrial Construction by Submarket. Source: CoStar.
Summary
Overall, the GTA industrial logistics market remains red-hot, with all-time-low availabilities and supply challenges. Although it is possible that supply may overshoot demand in the coming 18-24 months (for the first time in many years), long-term vacancies are forecast to stabilize at around 1%-1.5% in the coming 2-5 years.
In any event, businesses looking to fulfil their growth plans should plan ahead and consider their options between the Greater Toronto Core and secondary markets, such as the Greater Golden Horseshoe and Greater Hamilton Areas. Further, they should consider build-to-suit developments or joint-venture projects with reputable developers. While this option may take anywhere from 18 to 24 months to complete, it will ensure you have the right facility for your needs.
Many of our clients are approaching us looking to pre-lease or develop, and our team has access to specialists who can help guide and manage the process from inception through move-in.
On that note, if you would like our team to assist with any of your real estate needs, or if you would like to discuss anything mentioned in this article, please contact us directly.